

Artificially Inflated Risk
Artificially Inflated Risk
Shortcut to understanding relative vs. absolute risk using artificial sweetener research
WARNING: pledging a paid subscription to Shortcut U may result in deeper dives, special discounts, entertaining podcasts, and more…
Almost 2 years ago, I utilized a piece of cancer research in a post about relative vs. absolute risk to exemplify how data can be deceiving. During a recent dive into artificial sweetener research, I found another publication, which we’ll dissect here, that typifies the importance of distinguishing between relative and absolute metrics. To clarify, this post does not represent my view on artificial sweeteners and their health impacts as a whole – stand fast for a deep dive containing my findings in the research in this space.
In September, 2022, Debras et al. published Artificial sweeteners and risk of cardiovascular diseases: results from the prospective NutriNet-Santé cohort in which they followed 103,388 subjects – with an average age of 42.5 years old and 79.8% of whom were women – for 9 years, observing the relationship between artificial sweetener consumption (acesulfame potassium, aspartame, sucralose, and total consumption) and cardiovascular/cerebrovascular disease events. (I) To their credit, the authors utilized a more detailed food-frequency-questionnaire (FFQ) protocol, as compared to other studies using FFQs, in that they utilized 3 non-consecutive 24-hour records every six months, averaged the FFQ results for the first 2 years of the study, accounted for all artificial sweetener sources (not just those from coffee/tea or just those in diet sodas, for example), and leveraged blood markers and metabolic metrics to estimate underreporting. (I)
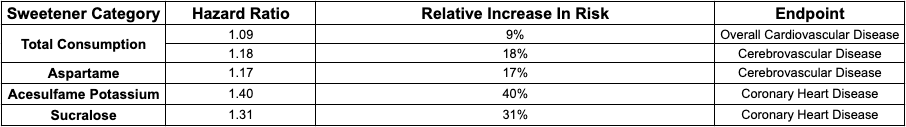
The study revealed a handful of statistically significant outcomes – meaning that the results likely did not occur by chance – including hazard ratios of 1.09 for total artificial sweetener consumption and overall cardiovascular disease, 1.18 for total artificial sweetener consumption and cerebrovascular disease (stroke and transient ischemic attack), 1.17 for aspartame and cerebrovascular disease, 1.40 for acesulfame potassium consumption and coronary heart disease (heart attack, acute coronary syndrome, angioplasty, and angina pectoris), and 1.31 for sucralose and coronary heart disease. (I) Hazard ratios can be easily translated into relative risk metrics, using 1.00 as the reference to represent no difference in risk and any deviance from 1.00 as a proportional change in relative risk. For example, the 1.09 hazard ratio for total artificial sweetener consumption and overall cardiovascular disease means that total artificial sweetener consumption is associated with a 9% relative increase in total cardiovascular disease events. Check out Table 1 below for a summary of the study’s hazard ratios and relative risk data.
So, from a zoomed-in perspective, it appears that artificial sweetener consumption – especially acesulfame potassium and sucralose with hazard ratios of 1.40 and 1.31, respectively – has a large effect on cardiovascular disease risk; however, if we zoom out and include absolute risk in our considerations, the picture is drastically altered. For example, the 9% relative increase in overall cardiovascular disease risk associated with total artificial sweetener consumption compares the risk of higher consumption to lower consumption on a spectrum, but it does not portray anything about raw, baseline risk – the risk of experiencing cardiovascular disease before looking at artificial sweetener consumption at all. Specifically, this study recorded absolute risk in person-years, a metric used to include data from participants that only contributed data across a portion of the study (check out this clip for an explanation of person-years). (I) After breaking the participants up into non-consumers, low-consumers (“intake below the sex specific median among consumers,”), and high-consumers, the authors found absolute incident rates of 346 per 100,000 person-years for high consumers and 314 per 100,000 person-years for non-consumers. (I) So, though high-consumers had a roughly 10% greater relative risk than non-consumers in person-years, they respectively showed 0.346% and 0.314% absolute risks of cardiovascular disease in person-years. As you can see, what appears to be a meaningful difference in relative risk can be trivial in terms of absolute risk – the latter difference being 0.032% in this case. Check out Table 2 for a summary of the absolute risk metrics from the study’s data.

To be fair, the hazard ratios from above were based on consumption of all or each artificial sweetener as continuous variables – spectrums running continuously from zero consumption to the highest consumption – rather than the non-consumer, low-consumer, and high-consumer cohorts used for the absolute incident rates. (I) Still, in absence of the absolute values, the study’s hazard ratios and relative risk differences can be portrayed as carrying great clinical significance – a term describing actual impact in outcomes – when, in actuality, the data shows nearly zero practical effects – a good example of why relative vs. absolute risk matters.
Check out Dr. Layne Norton’s take on the study discussed above.