


What's the Best Plant-Based, "Milk," Option?
Vegans, Vegetarians, and Lactose Intolerant Folks Take Note

If you read the title and are looking for a classic animal-based vs. plant-based ideological clash, you’re going to be disappointed. However, fortunately (or unfortunately, depending on how you look at it) for you, as I understand it, there are plenty of carnivores and vegans throwing down in the comments across social media and the overarching internet, so you can tune in there.
Here, I’m going to break down one research study I recently read regarding the macronutrient and micronutrient differences between cow’s milk and a bunch of plant-based milk alternatives.
Instead of making a case about whether I think we should be drinking cow’s milk or switching to a plant-based alternative (again, I’m confident you can find this type of content in abundance on social media), I’ll be directing this post at individuals who are already choosing to avoid animal milk but are looking to find out which alternative is the best option.
This group will include vegans and vegetarians, as well as individuals with lactose intolerance or for whom dairy simply doesn’t sit well with in terms of digestion.
In case you too are a nerd and are looking for some interesting research to read, the main paper I’ll be referencing below is, “Comparison of nutritional composition between plant-based drinks and cow’s milk.” (I)
Friendly Disclaimer: I am not a doctor, and none of the information below is medical advice in any way, shape, or form. You are responsible for conducting your own research, consulting your medical professionals, and making your own decisions.
When it comes to replacing cow’s milk, there are two main nutrients I hear a lot of concern around: protein and calcium. So, let’s start there.
Protein
In their 2022 paper, Walther and Colleagues’ selected 27 products–including two whole milk products and a plethora of plant-based milk alternatives—from a couple of Swiss supermarkets and tested them for their macronutrient and micronutrient contents. (I)
In terms of protein, they looked at quantity in terms of total grams, as well as quality based on the products’ amino acid profiles and their Digestible Indispensable Amino Acid Scores (DIAAS)—a measure of protein quality based on several factors, including digestibility and amino acid requirements of the given reference age group. (I)
“The Digestible Indispensable Amino Acid Score (DIAAS) method, based on the ileal digestibility of individual indispensable amino acids in relation to the amino acid reference pattern for human requirements, is nowadays seen as a standard for protein quality determination as recommended by [Food and Agriculture Organization] (21, 46, 47). The DIAAS also considers the effect of anti-nutritive compounds that interfere with digestion, such as phytic acid, polyphenols, and protease inhibitors. Even if clinical evidence linking DIAAS with clinical health outcomes remains in development, consumption of proteins with low DIAASs was associated with lower muscle protein synthesis.” (I)
In each of these measures, cow’s milk significantly outperformed all of the other options, except for the soy milk products that shared similar results with the cow’s milk products on average. (I)
In terms of total protein, the non-soy, plant-based alternatives ranged from 1.7-13.3 grams of protein per kilogram of beverage on average. If we assume that one serving (~one cup) is roughly 250 grams of liquid, then this equates to 0.43-3.33 grams of protein per serving/cup. (I)
Cow and soy milk, on the other hand, respectively averaged 32.6 and 37.8 grams of protein per kilogram of liquid, or 8.15 and 9.45 grams per serving/cup, respectively, based on the same calculation used above. (I)

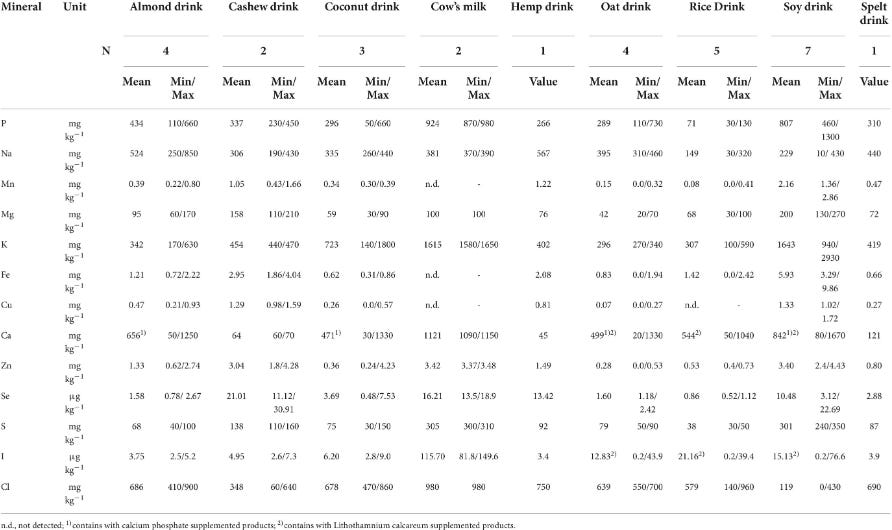
“The crude protein contents of the plant-based drinks ranged from a minimum of 0.6 g kg–1 in a rice drink to 43.0 g kg–1 in a soy drink. The highest mean protein contents in the plant-based drinks were found in the soy drinks, followed by the cashew and almond drinks…The mean protein values in the oat-, coconut-, and rice-based beverages were very low. The values in the individual samples of spelt and hemp drinks were both at an in-between level…The mean crude protein content of milk was 32.6 g kg–1 and thus was within the range for soy-based beverages.” (I)
From a protein quality perspective, if you look at Figure 1 from the study below, you’ll see that both cow and soy milk are, “head and shoulders,” above the other options in terms of essential and non-essential amino acid concentrations as well. (I)

In addition, while the other options showed average DIAAS for the reference group, “children older than 3 years, adolescents, and adults,” ranging from 39% to 78.8% (the higher the score the better for protein quality), the cow and soy milk selections averaged 145% and 107.6% for this reference group, respectively. (I)
In particular, the coconut (71.8%) and cashew (71.9%) selections performed the best in terms of DIAAS out of the non-soy plant-based alternatives; whereas, the almond (39%), spelt (41%), and rice (43.1%) options were amongst the lowest of the non-soy plant-based group. (I)
And, the results are directionally similar for the other age reference groups (6 months to 3 years and birth to 6 months) with cow and soy milk at the top and the other options being significantly inferior–notably, the soy milk options (71.2%) actually slightly outperformed the cow’s milk options (65.4%) on average for the birth to 6 months reference group. (I)
NOTE: The DIAAS are different for different age groups because the protein requirements change during different points of life.

So, when it comes to protein, two things stick out to me from this study:
Soy milk is significantly better across the board as compared to all of the other plant-based options. (I)
Soy milk is fairly comparable to cow’s milk in terms of the protein metrics looked at in this study. (I)
Calcium
How about for calcium?
The results for average calcium content are somewhat similar to those for average total protein content with cow’s milk (1,121 g/kg) at the top, followed by soy milk (842 g/kg) and the rest of the plant-based alternatives (45-656 g/kg). (I)
However, one key difference is that there is much greater variability between different products of the same type of drink. In other words, while the protein content for the 7 different soy products was fairly similar—ranging from 34-48 g/kg—their calcium contents varied widely from 80 to 1670 g/kg. (I)
And, the same is generally true for the majority of the other plant-based alternatives. (I)
In addition, interestingly, the only individual plant-based products that had similar or superior calcium contents as compared to the two cow’s milk options were the one’s that were fortified (i.e. the manufacturers added calcium to the beverages). (I)
This is well displayed by Figure 2 (named Supplementary Figure 2 in the actual paper) below, where the non-fortified plant-based options depicted without a star pale in comparison to the cow’s milk options in terms of calcium content. (I)
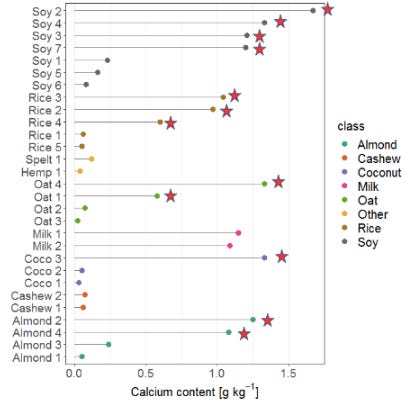
“Compared with milk, the plant-based drinks contained lower amounts of phosphorus, potassium, calcium, zinc, sulfur, iodine, and chloride...Some drinks made of almond, coconut, oat, rice, and soy were fortified with tricalcium phosphate or calcium containing algae (L. calcareum; Supplementary Table 1). All drinks without fortification had significantly lower calcium contents than milk (p < 0.05).” (I)
Importantly, the authors do raise the question of how the fortified calcium contents compare to the calcium naturally present in cow’s milk:
“In the case of fortified drinks, the question arises as to how the bioavailability of these added minerals and vitamins compares with milk…Milk is a well-known natural source of calcium and 13 out of 27 plant-based beverages were fortified in this element either using (tri)calcium phosphate or L. calcareum (red algae)...However, the bioavailability of tricalcium phosphate was shown to be 25% less in a soy-based beverage relatively to milk calcium (73). Furthermore, the use of red algae that shows similar properties as calcium carbonate raises discussions about its ecological impact” (I)
Regardless of bioavailability (i.e. how much can actually be digested, absorbed, and utilized), though soy milk did come out on top in terms of averages, it appears that, one way or another, only fortified options will provide similar or greater total calcium as compared to cow’s milk. (I)
Additional Considerations
On top of protein and calcium, there were a few things that stuck out to me in this study.
First, when the authors broke things down in terms of recommended daily allowances (RDAs), both the cow and soy milk selections provided >10% of the RDA for several nutrients on average.(I) In comparison, the remaining plant-based selections only provided >10% of the RDA for a few nutrients at best and zero nutrients at worst. (I)
“One portion (200 mL) of milk contributes to an average of > 10% of the RDA for biotin (11.5%, 9.8–13.3%); pantothenic acid (11.9%, 11.0–12.9%); vitamin B2 (19.7%, 19.6–19.8%); minerals and trace elements, including phosphorus (26.4%, 24.9–27.9%), calcium (22.4%, 21.9–23.0%), and iodine (15.4%, 10.9–20.0%); and macronutrients, namely protein (13.6%, 13.6%) and fat (11.3%, 11.2–11.5%; Supplementary Table 7). The variability of the contents of the milk samples was low, except for iodine.” (I)
“One portion (200 mL) of soy drink contributes an average of > 10% of the RDA for vitamin B2 (10.5%, 1.5–39.7%); folic acid (23.5%, 14.4–31.4%); vitamin E (47.0%, 29.3–64.4%); vitamin D2 (11.4%, 0–13.7%); vitamin K1 (11.5%, 7.1–15.9%); minerals and trace elements, including phosphorus (23.1%, 13.1–37.0%), manganese (12.3%, 7.8–16.4%), magnesium (13.4%, 8.7–18.2%), copper (21.3%, 16.3–27.4%), and calcium (16.8%, 1.7–33.5%); and the macronutrient protein (14.1%, 11.7–17.9%; Supplementary Table 7).” (I)
“All other plant-based drinks had < 10% contributions of most nutrients, except the almond, oat, and rice drinks for calcium (13.1%, 1.1–25.0%; 10.0%, 0.3–26.7%; and 10.9%, 1.0–20.8%, respectively), almond and hemp for vitamin E (18.4%, 7.0–38.4% and 29.2%, respectively), almond for phosphorus (12.4%, 3.1–18.7%), cashew for magnesium and copper (10.6%, 7.4–13.7% and 20.8%, 15.7–25.5%), and hemp for vitamin K1 (10.6%), copper (13.0%), and fat (10.4%; Supplementary Table 7). However, the individual plant-based beverages differed considerably in their respective contributions.” (I)
Second, while cow’s milk offered little vitamin E, some of the plant-based options—namely, almond, hemp, and soy—were significant sources of vitamin E on average. (I)
Notably, soy provided significantly more vitamin E than all of the other selections on average, and it was the only type of beverage that showed a significant amount of vitamin E in each of its individual product selections. (I) This is likely because soy milk naturally contains a significant amount of vitamin E, while all of the other options that contain a significant amount of vitamin E do so because they are fortified with sunflower oil (See Figure 3 below). (I)

“In some of the plant-based drinks such as hemp (1), oat (4), rice (5), and spelt (1), sunflower oil was added and therefore likely contributed to increasing the vitamin E level (51.75 mg 100 g–1) (34), as sunflower oil is naturally rich in this vitamin (Supplementary Table 1). Thus, these drinks had higher vitamin E content than milk but lower vitamin E content than soy drinks. The soy drinks also provided significantly higher amounts of folic acid than milk, and all other plant-based drinks (p < 0.05).” (I)
In addition, as the tail-end of the quote above describes, the soy milk selections contained significantly more folic acid (i.e. vitamin B9 (II)) individually and on average compared to all of the other beverages (See Figure 4 below). (I)

Lastly, the cow’s milk options (649 calories per kg of beverage according to calculations based on amount of fat, carbohydrates, and protein) had the highest amount of calories on average out of all of the beverage types. (I) However, I think this reflects that the researchers chose to only include whole cow’s milk options, as opposed to lower calorie, lower fat options. (I)
And, even using the higher calorie whole milk options, the average calorie difference compared to the soy milk selections, for example, is smaller in an absolute sense when applying the per serving/cup calculation we used for protein above–now, the difference is 162.25 calories per serving/cup vs. 99 calories per serving/cup, respectively. (I)
Conclusions
Based on this study, it appears to me that soy milk is a significantly superior option when it comes to plant-based milk alternatives. (I)
Not only did the soy milk selections outperform the other plant-based options in terms of the, “heavy hitters,” when it comes to cow’s milk–protein and calcium–but it also showed significantly superior results in terms of providing >10% of the RDA for several nutrients and offering a large fraction of the RDA for vitamin E (47%) and folic acid (23.5%) in particular. (I)
Importantly, some of these metrics are dependent on the soy milk selection being fortified. (I) So, if it were me, I would make sure to check the nutrition labels on my soy milk products to make sure I got the fortified ones.
Notably, the authors of the study cited above do address that many people have soy allergies. (I) Again, if this were me, I would probably find another way to get in the nutrients I might be missing from cow or soy milk because I was not impressed by any of the other plant-based options from this study—they all performed poorly overall, in my opinion. (I)
P.S. All of my content is currently free to everybody. BUT, you do have the option of paying for a subscription if you feel Shortcut U has provided value to you. This would be beneficial for me, but doing so would also be beneficial for you because it would enable me to invest more time and resources into providing more and better content. Either way, thanks for reading.